
A tour of the portal
The menu on the left has the same structure for everyone; which pages it holds depends on your role. This is what a client account sees. Every page has a ? button with an explanation of exactly that screen.
Overview
Section titled “Overview”The landing page after logging in. At the top, one sentence says whether everything is fine. Below it: a list of what needs attention (with a button to the page where you fix it), tiles for stacks, backups, alerts, disk space and certificates, the stacks with their state and the latest jobs.
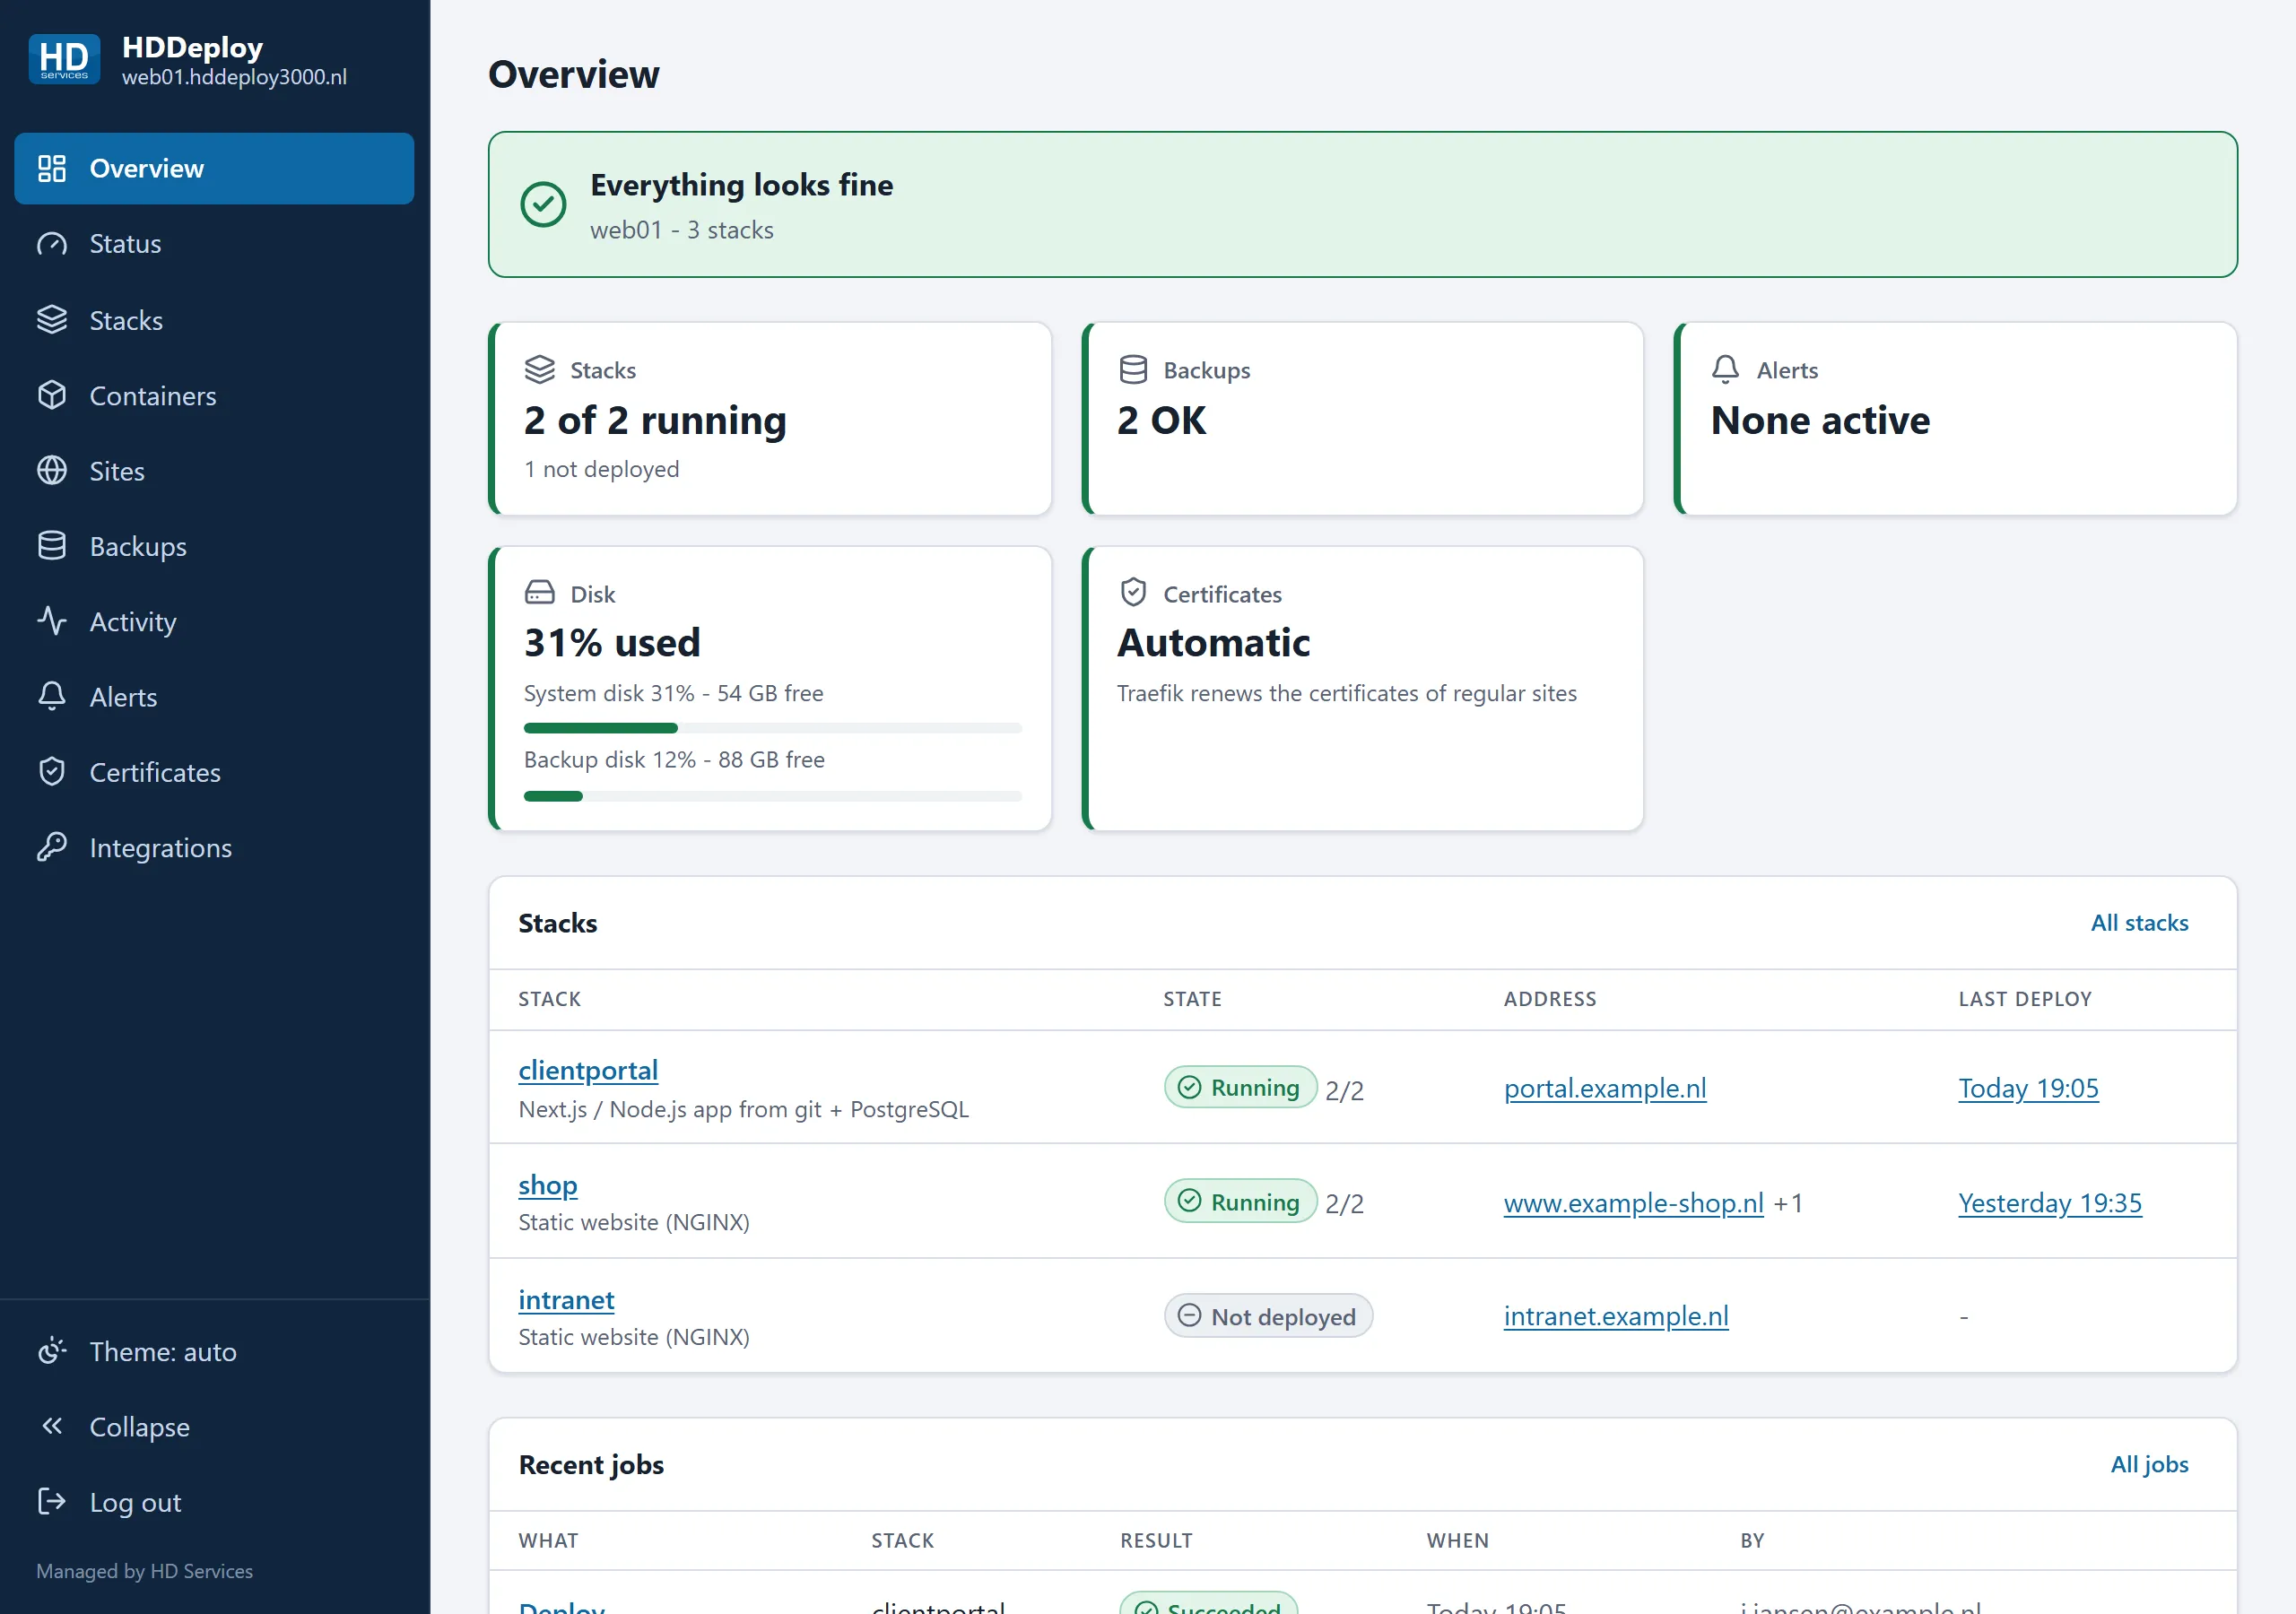
When something is wrong it is listed at the top with a badge that says what is going on:

Status
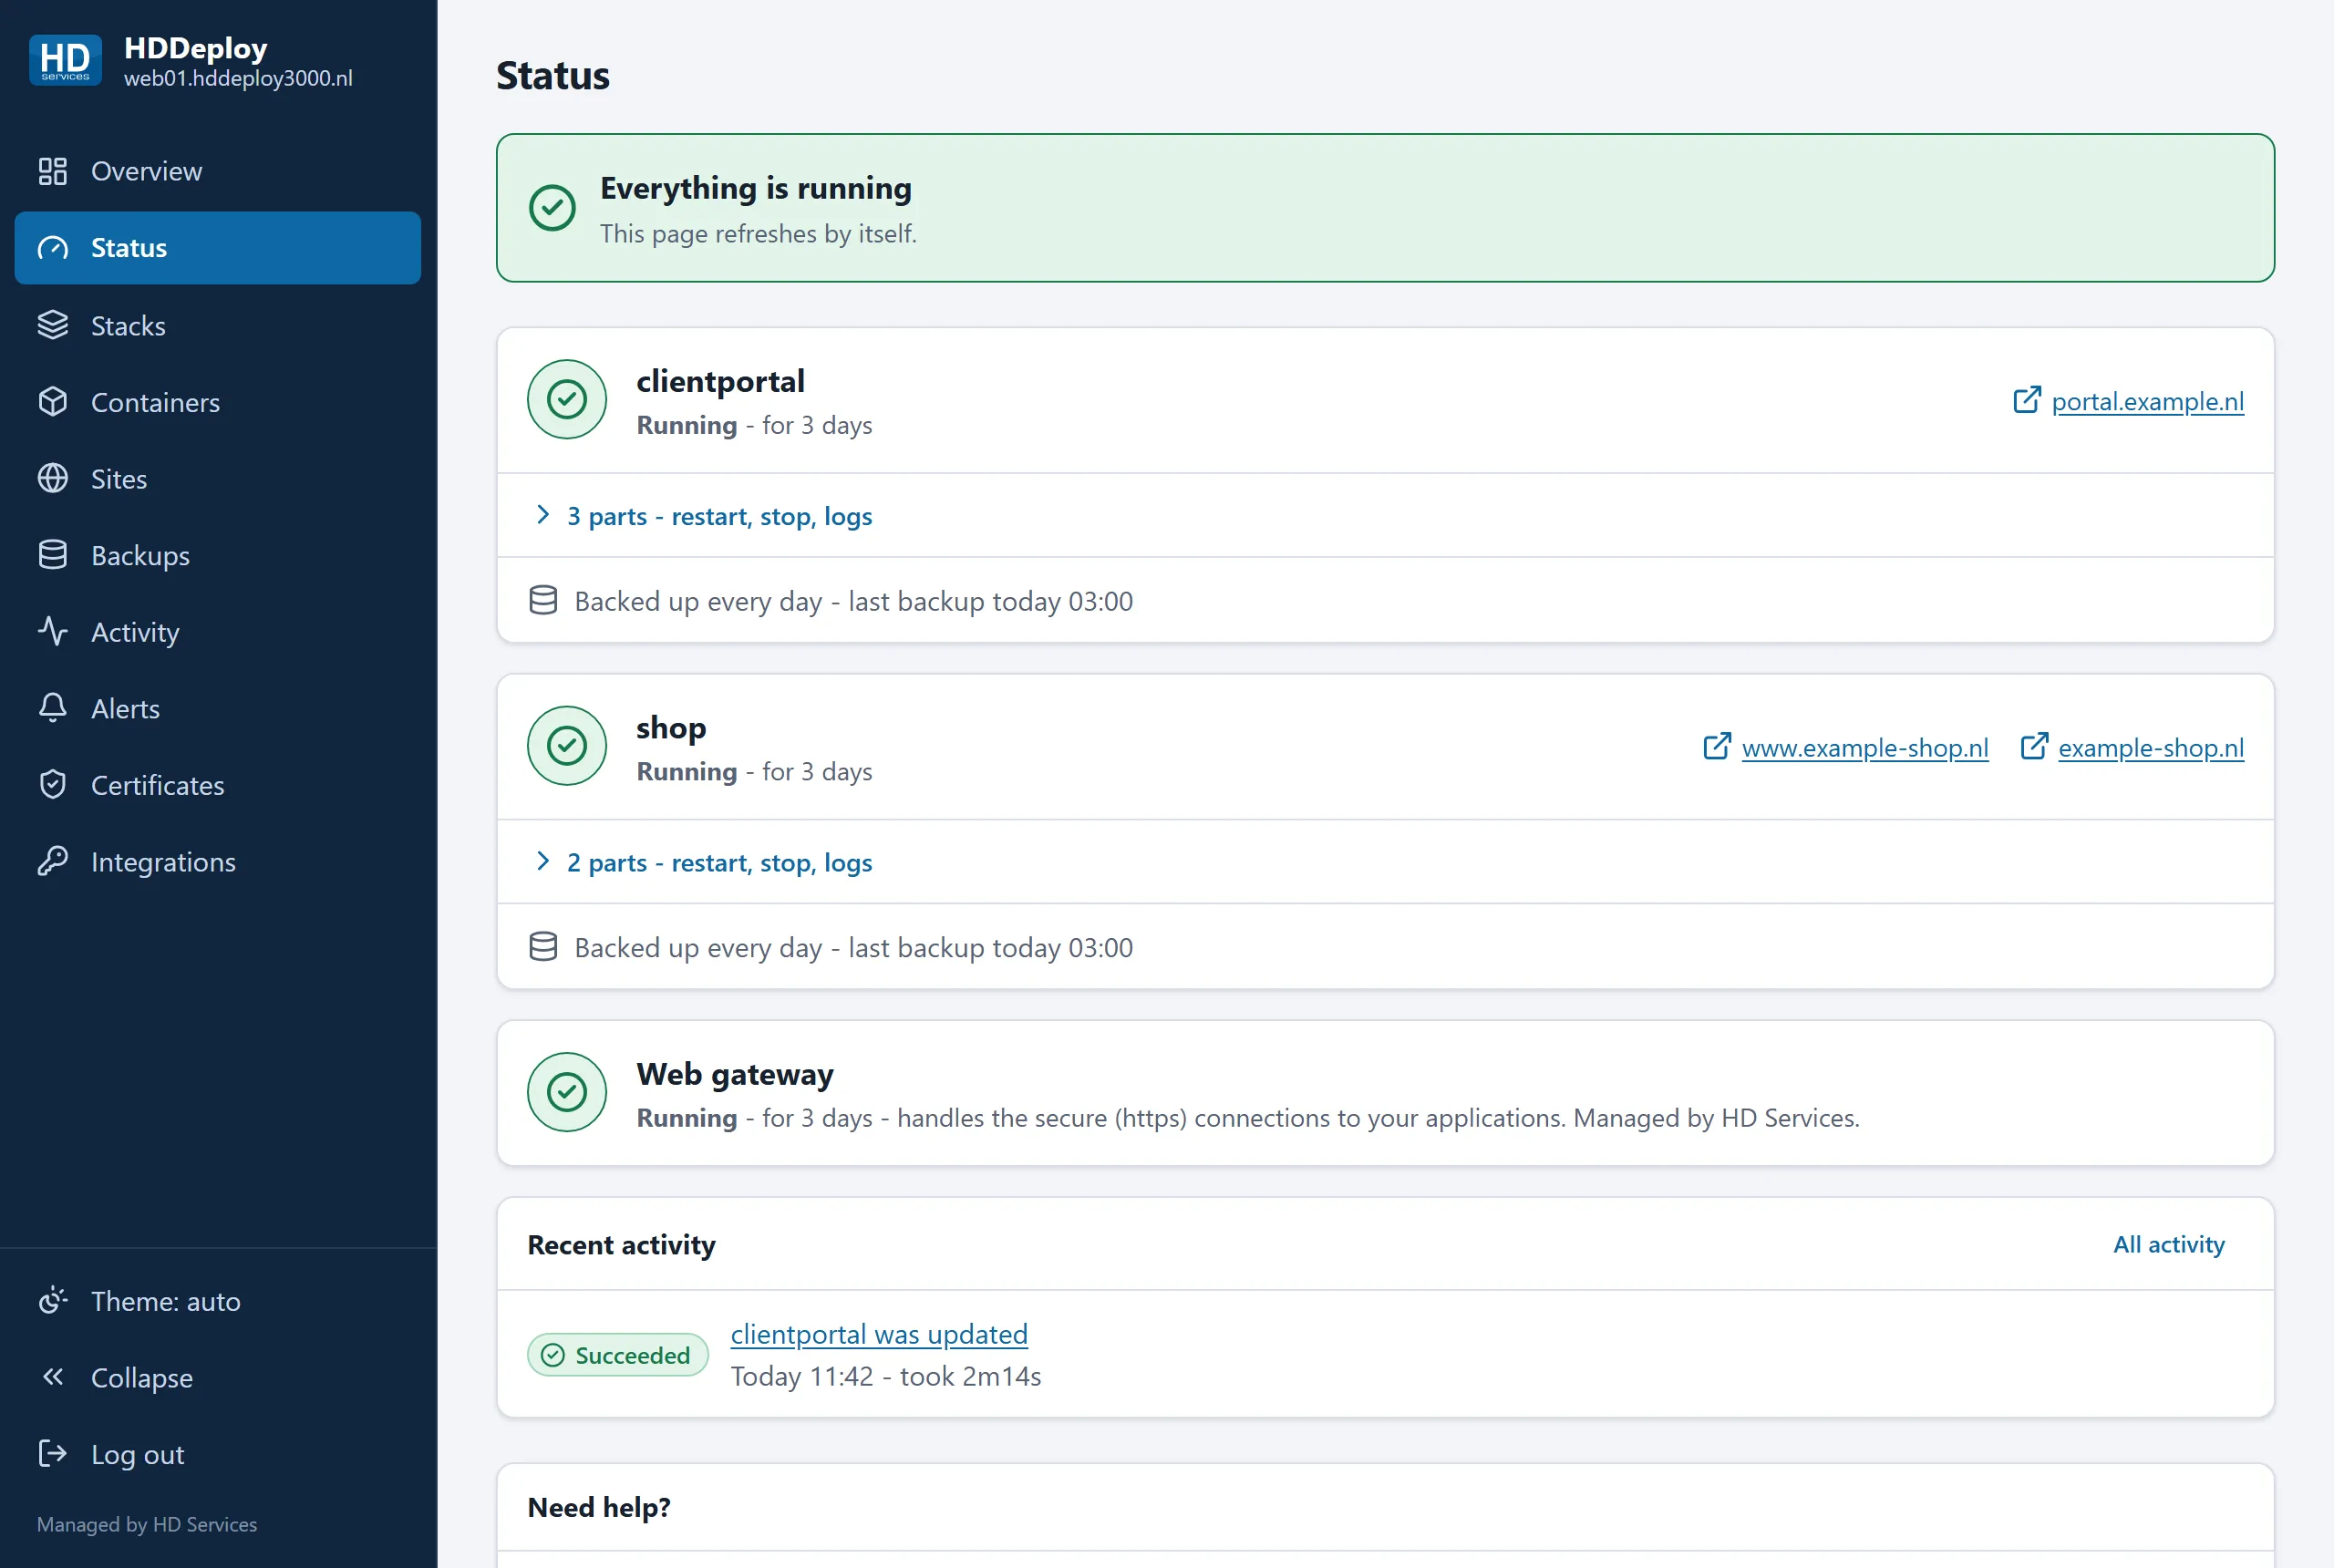
Section titled “Status”A simple view of the same information, meant to share quickly or to leave on a second screen: per application whether it runs, where it is reachable, when the last backup was and the latest activity in plain sentences. The page refreshes by itself.
Stacks
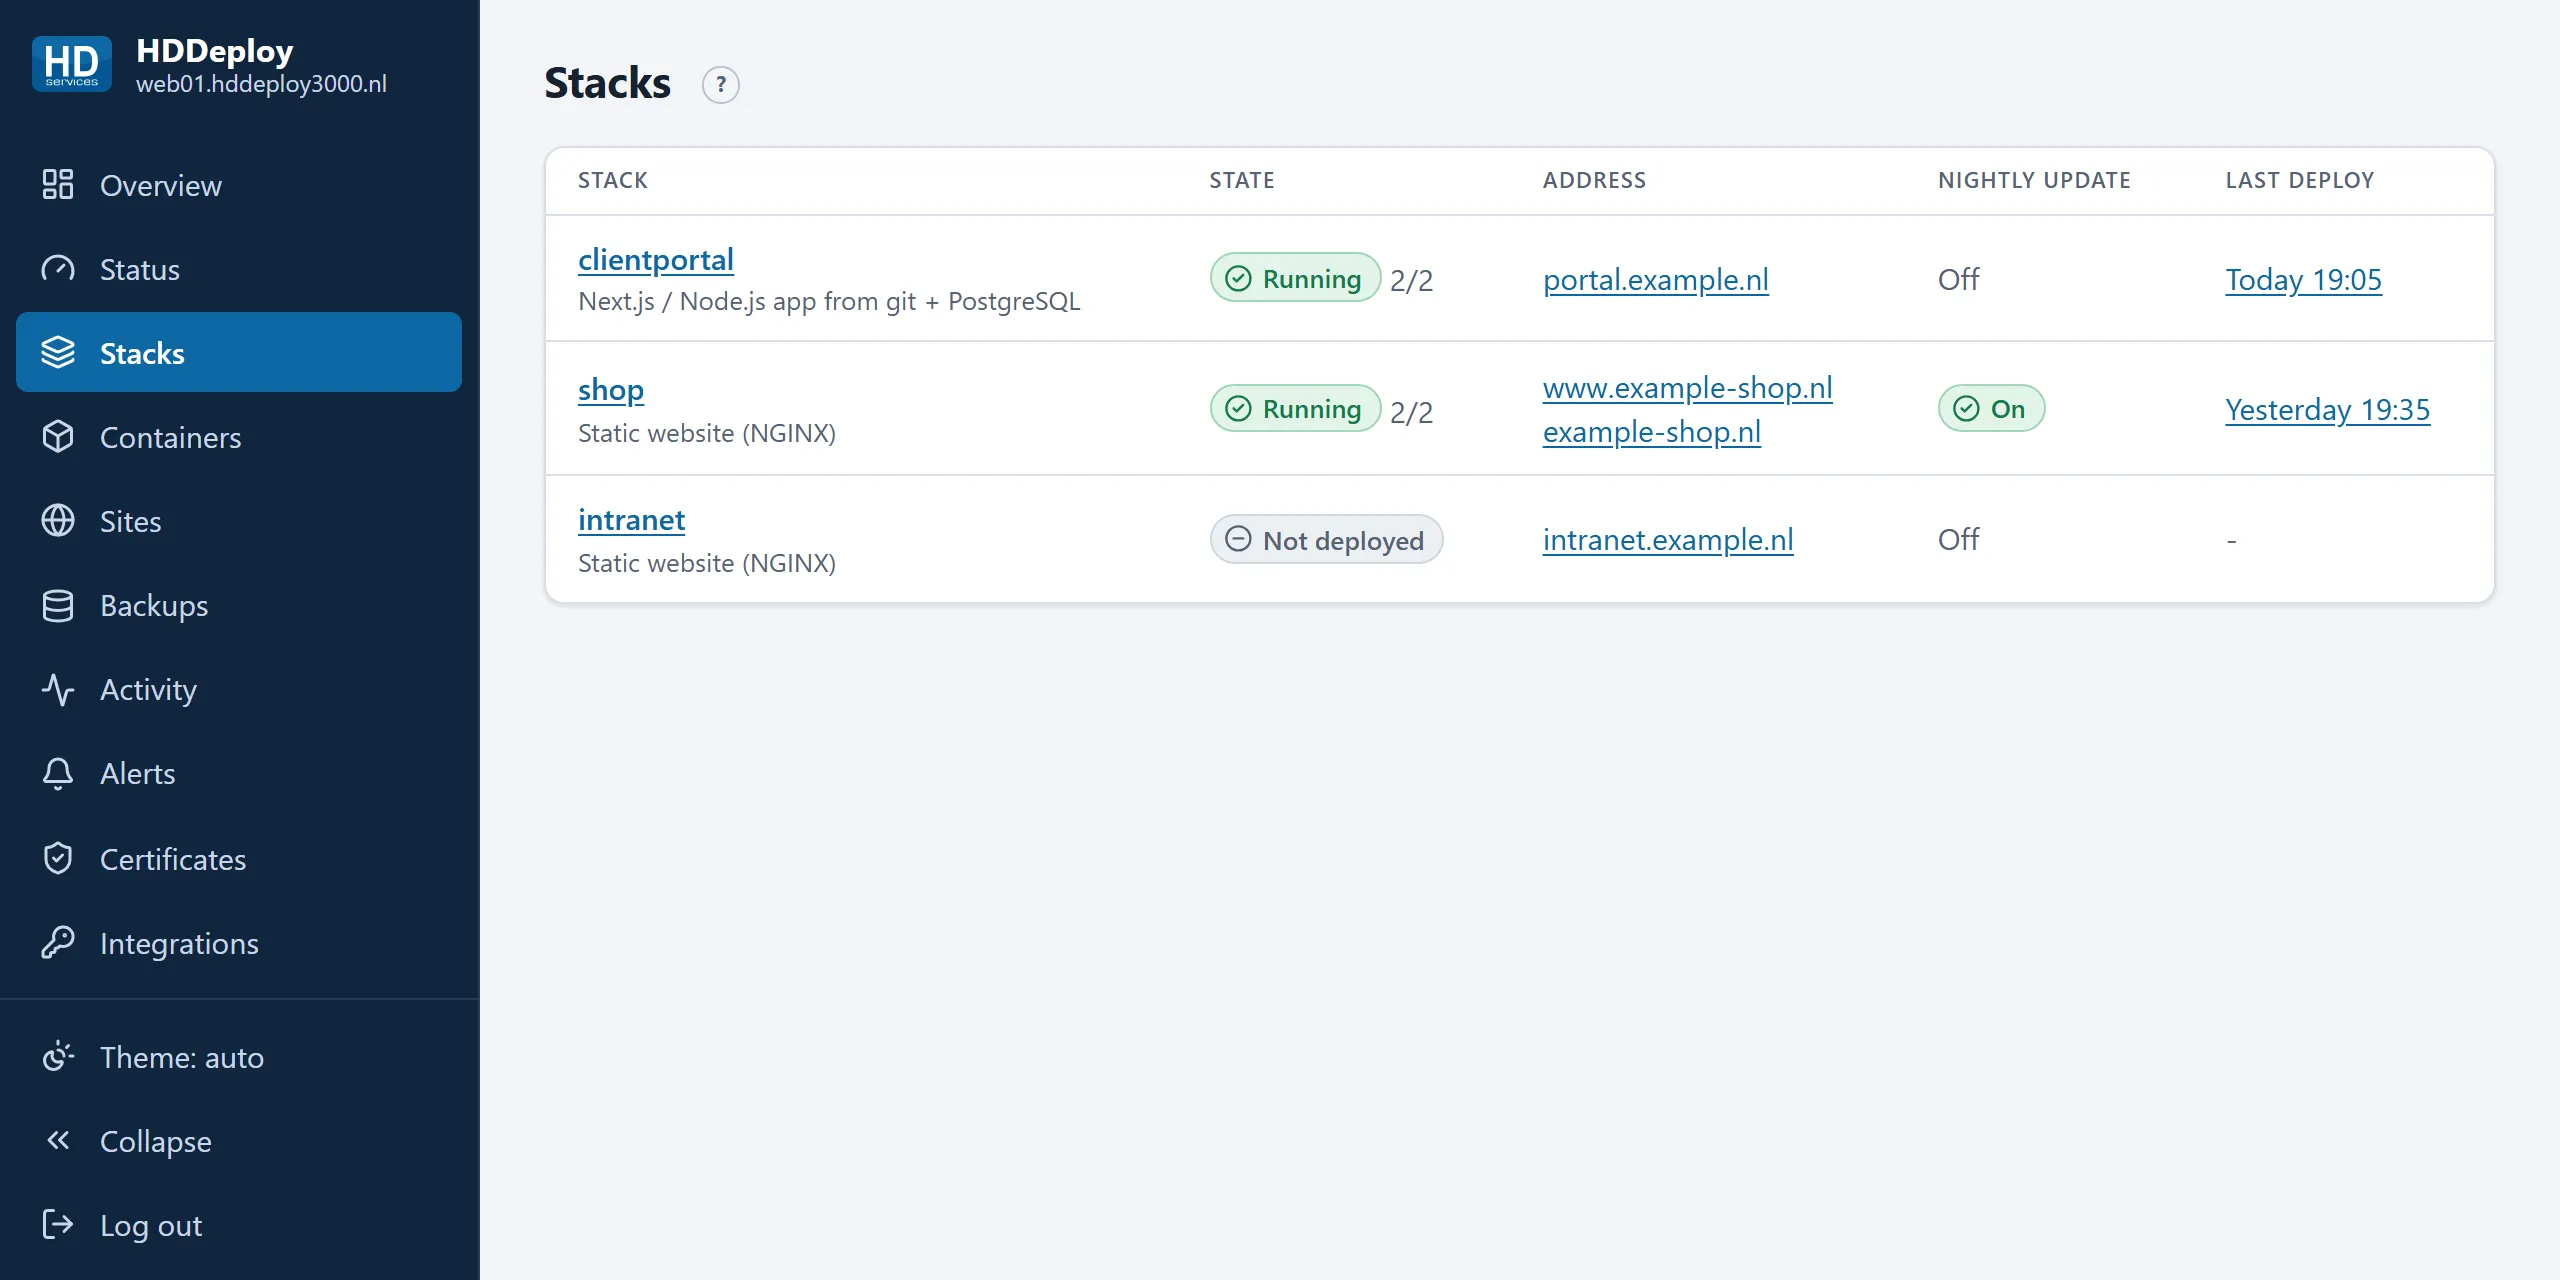
Section titled “Stacks”Your applications. Per stack you see the state (how many containers run), the address, whether the nightly update is on and the last deploy. Click a name for the stack’s page, with tabs for settings, webhooks, revisions and the raw files. More in Stacks: your applications.
Containers
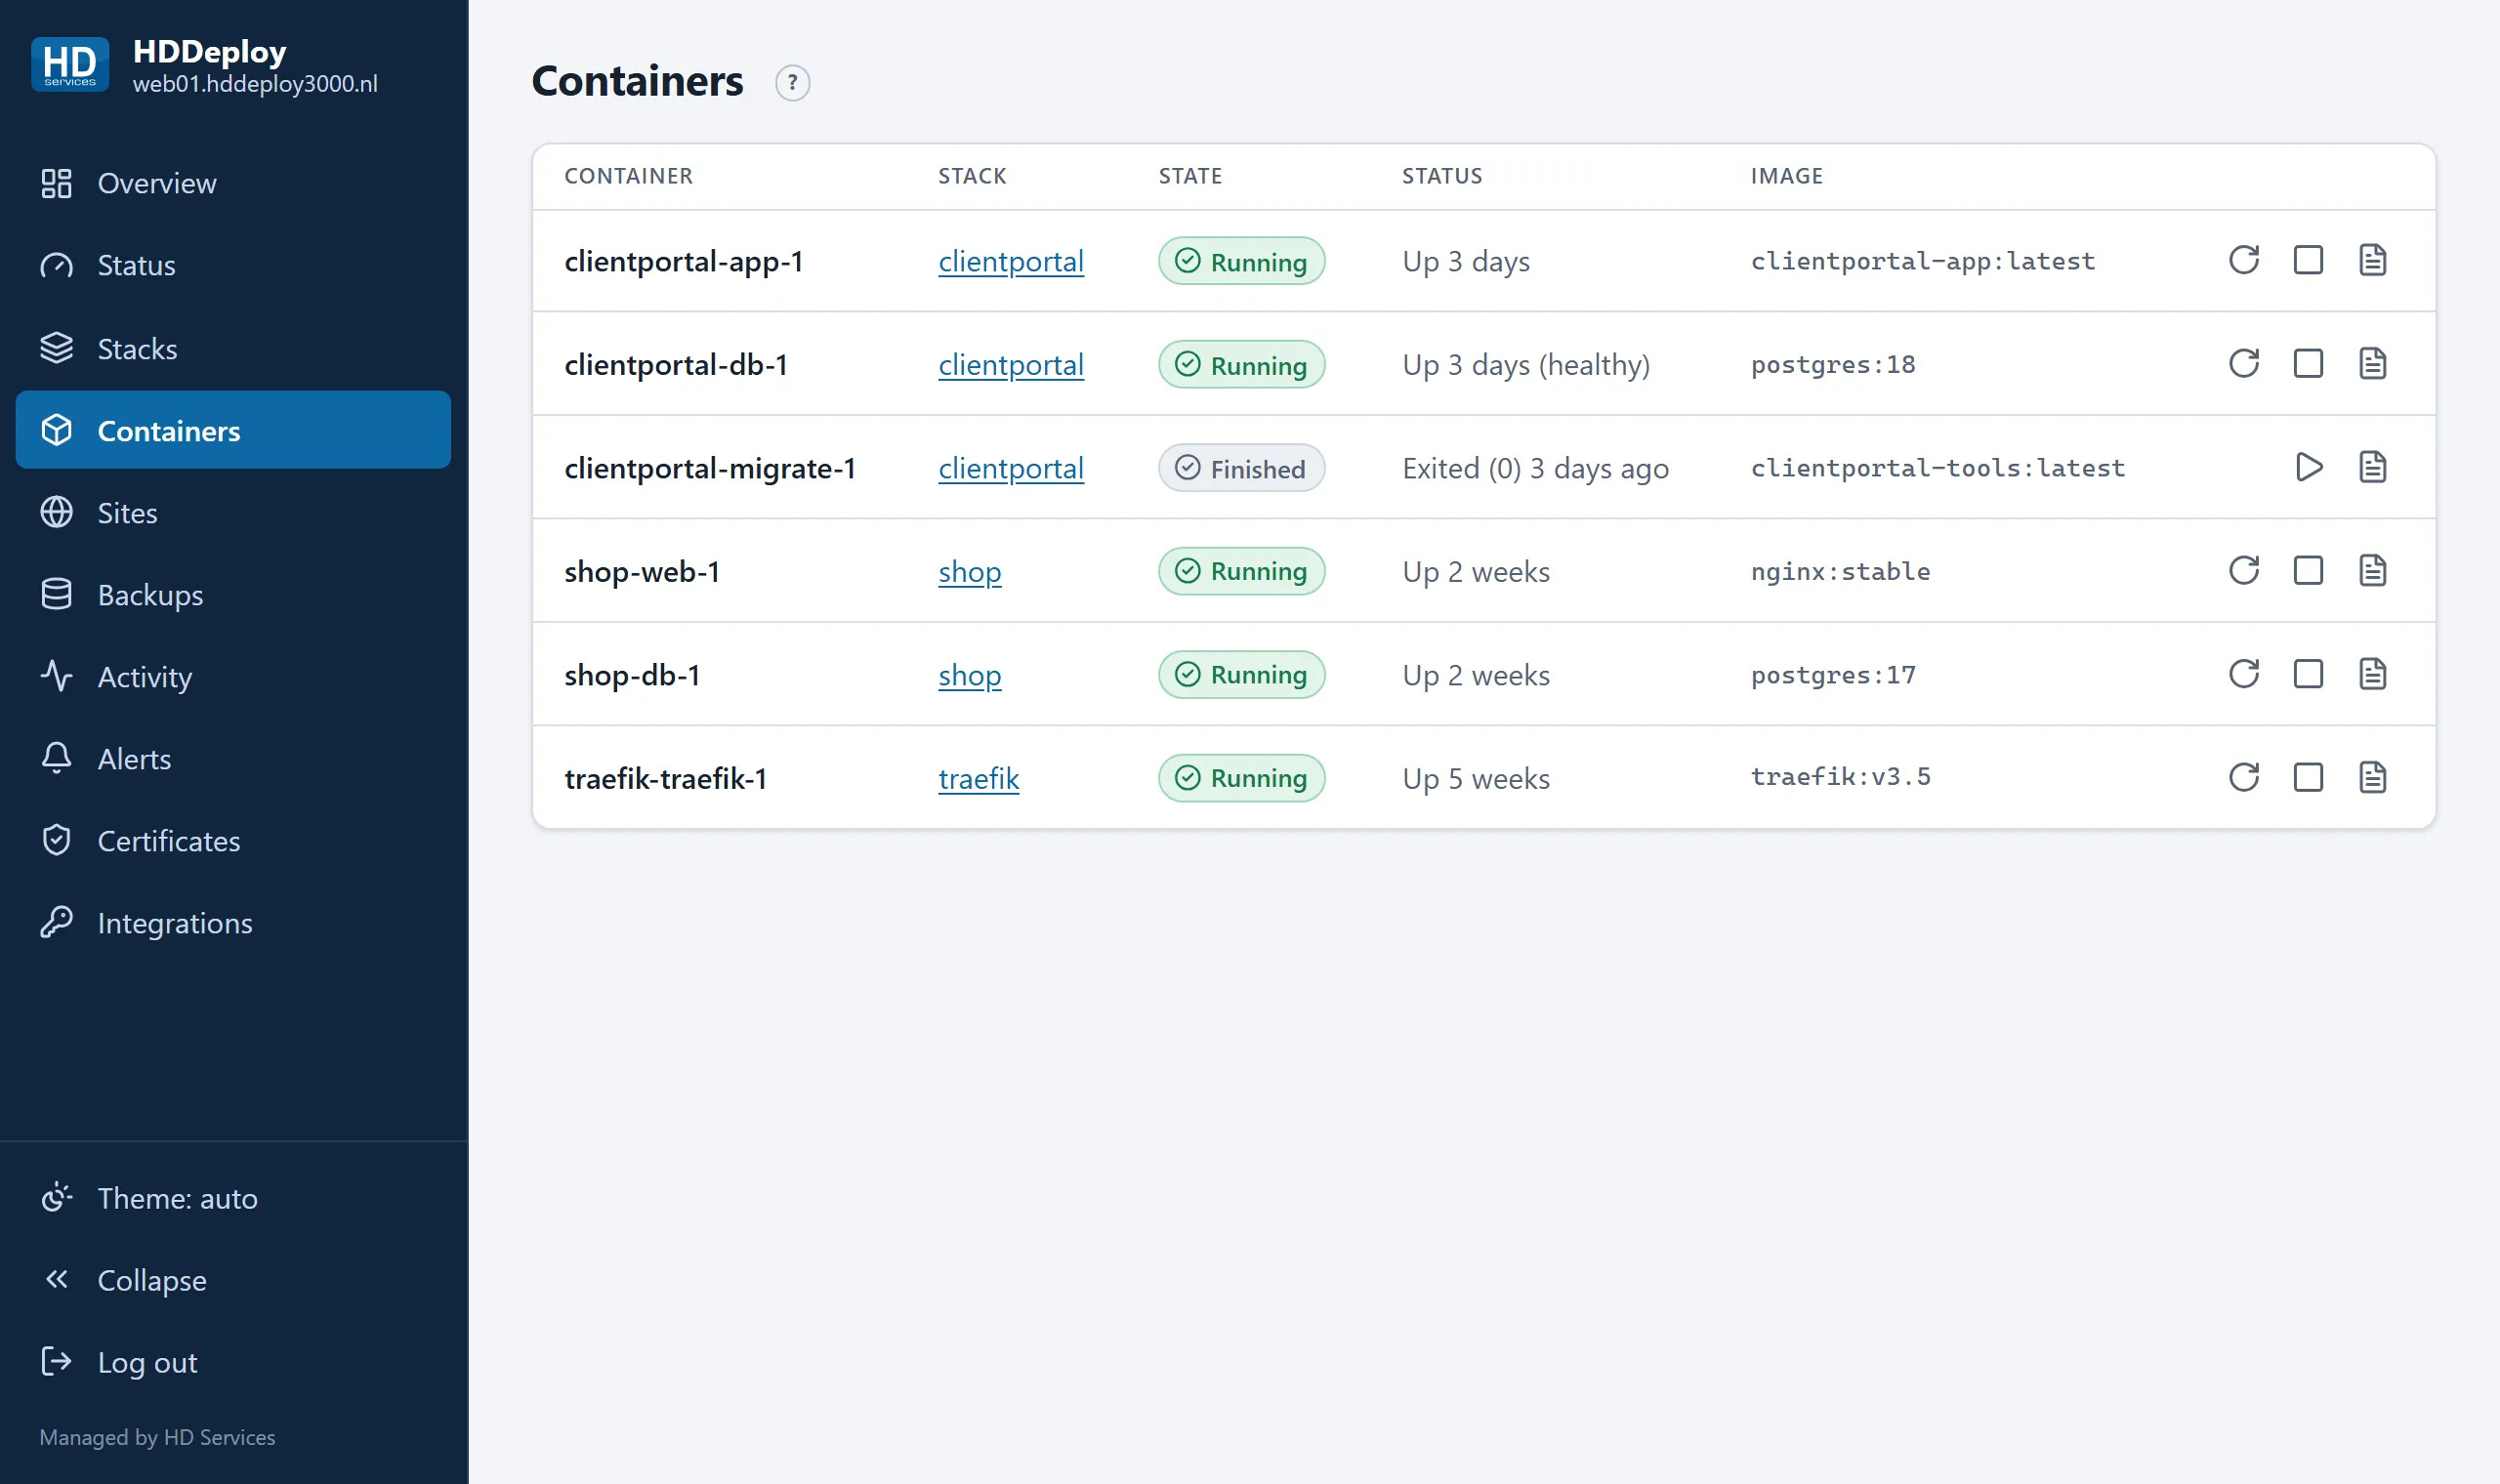
Section titled “Containers”Every container on the server, with its stack, state and role. Here you start, stop and restart a container and read its log. Containers of HD Services (the web gateway) and protected services are locked. More in Containers and logs.
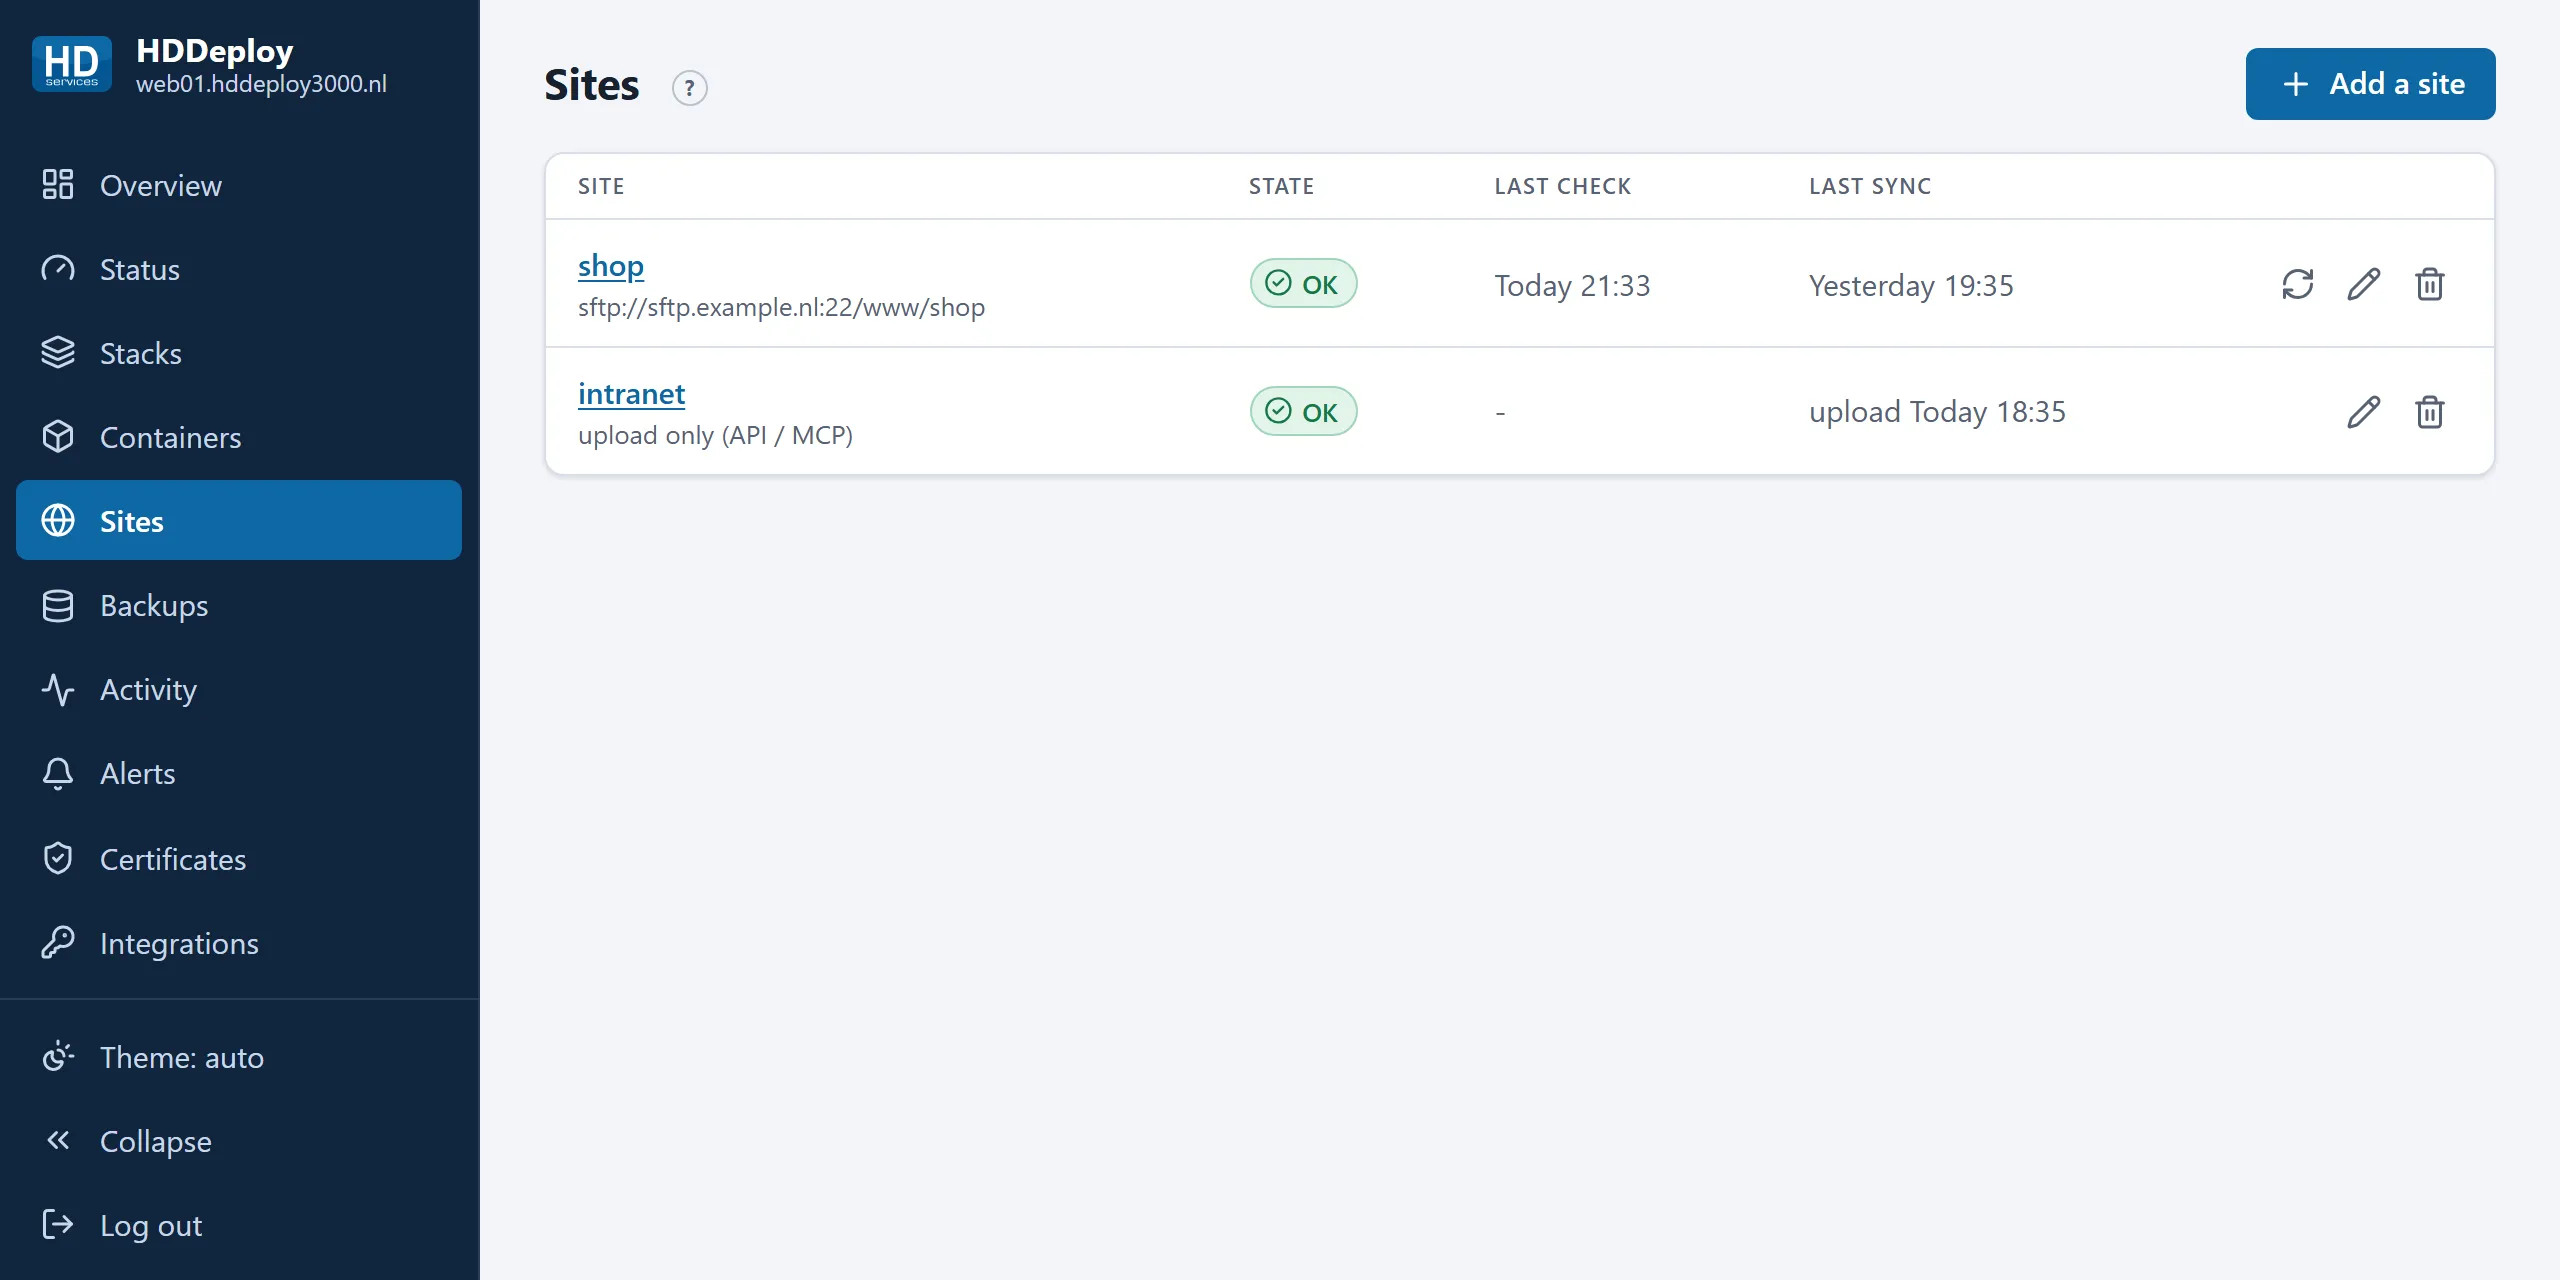
Static websites: directories of files served by a stack. Per site you see the source (an FTP location or “upload only”), the last check and the last sync or upload. More in Sites: static websites.
Backups
Section titled “Backups”The backups of databases, file volumes and git repositories: when they run, the result, the files. You can run one now or add a new backup. More in Backups.
Activity
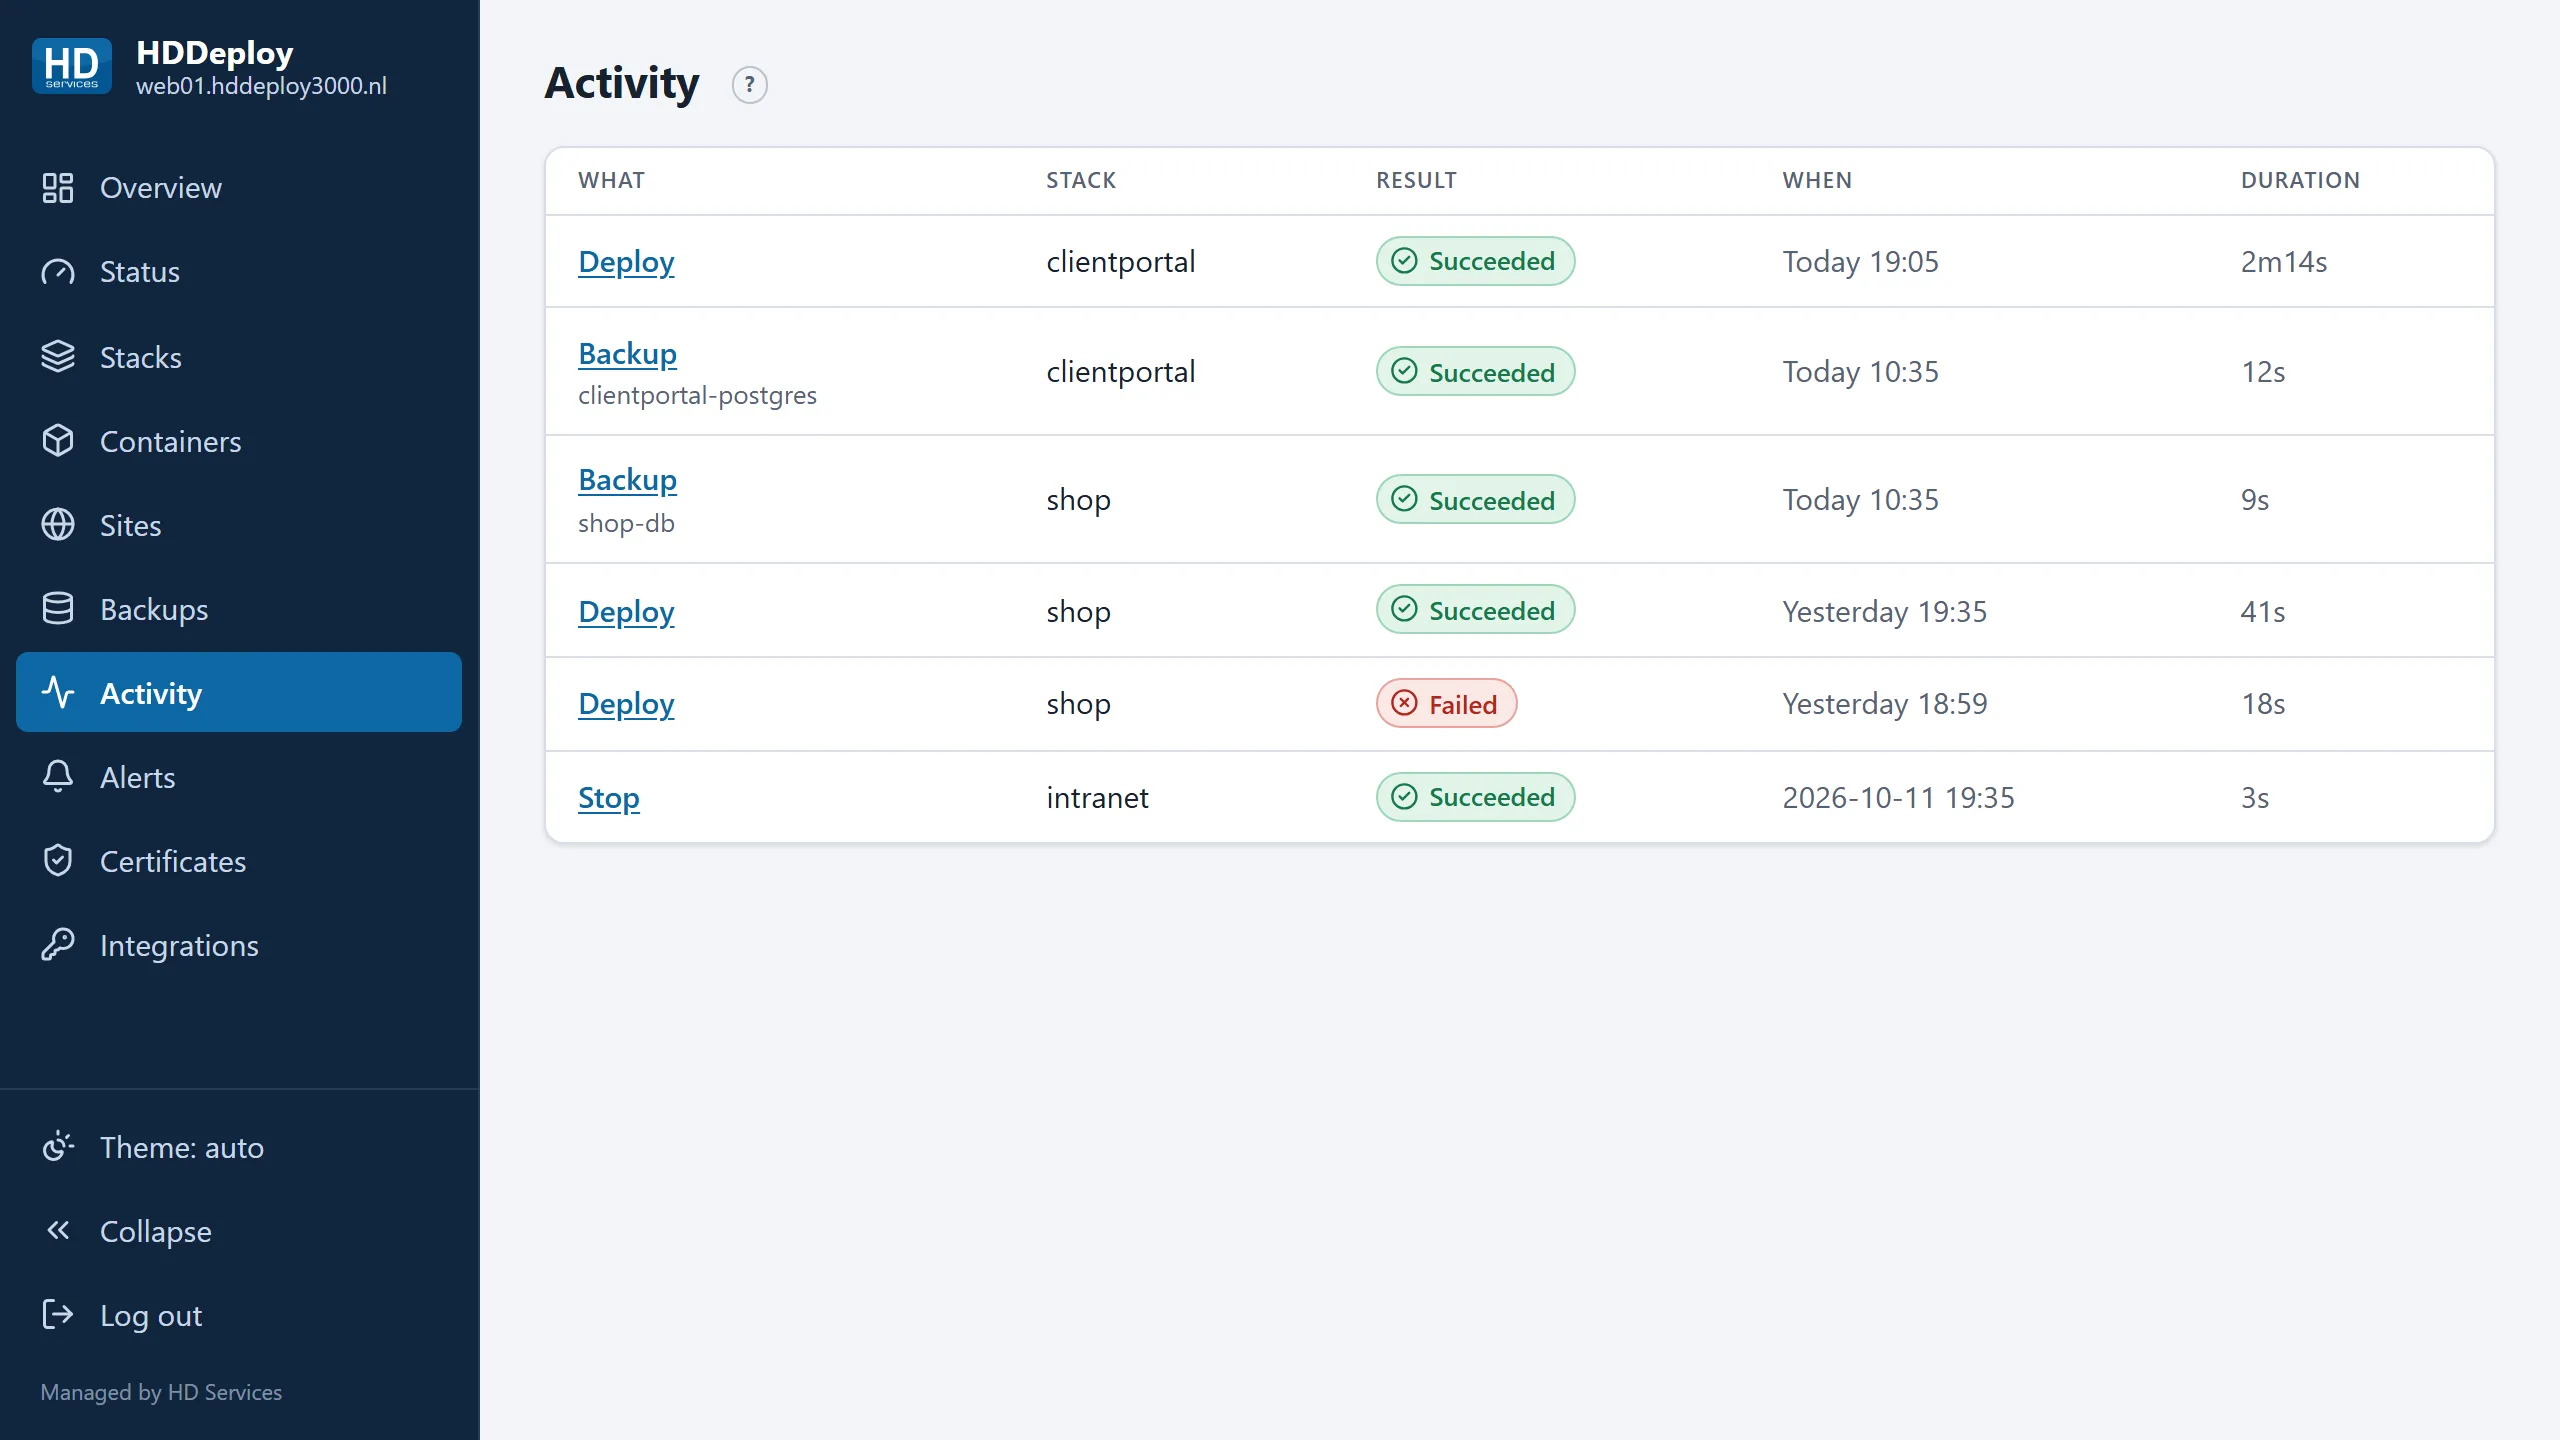
Section titled “Activity”Everything that was executed on the server: deploys, stops, backups, image downloads. Every line names who started it (a user, a token, a webhook or the scheduler), the result and the duration. Open a line for the full output.
Alerts
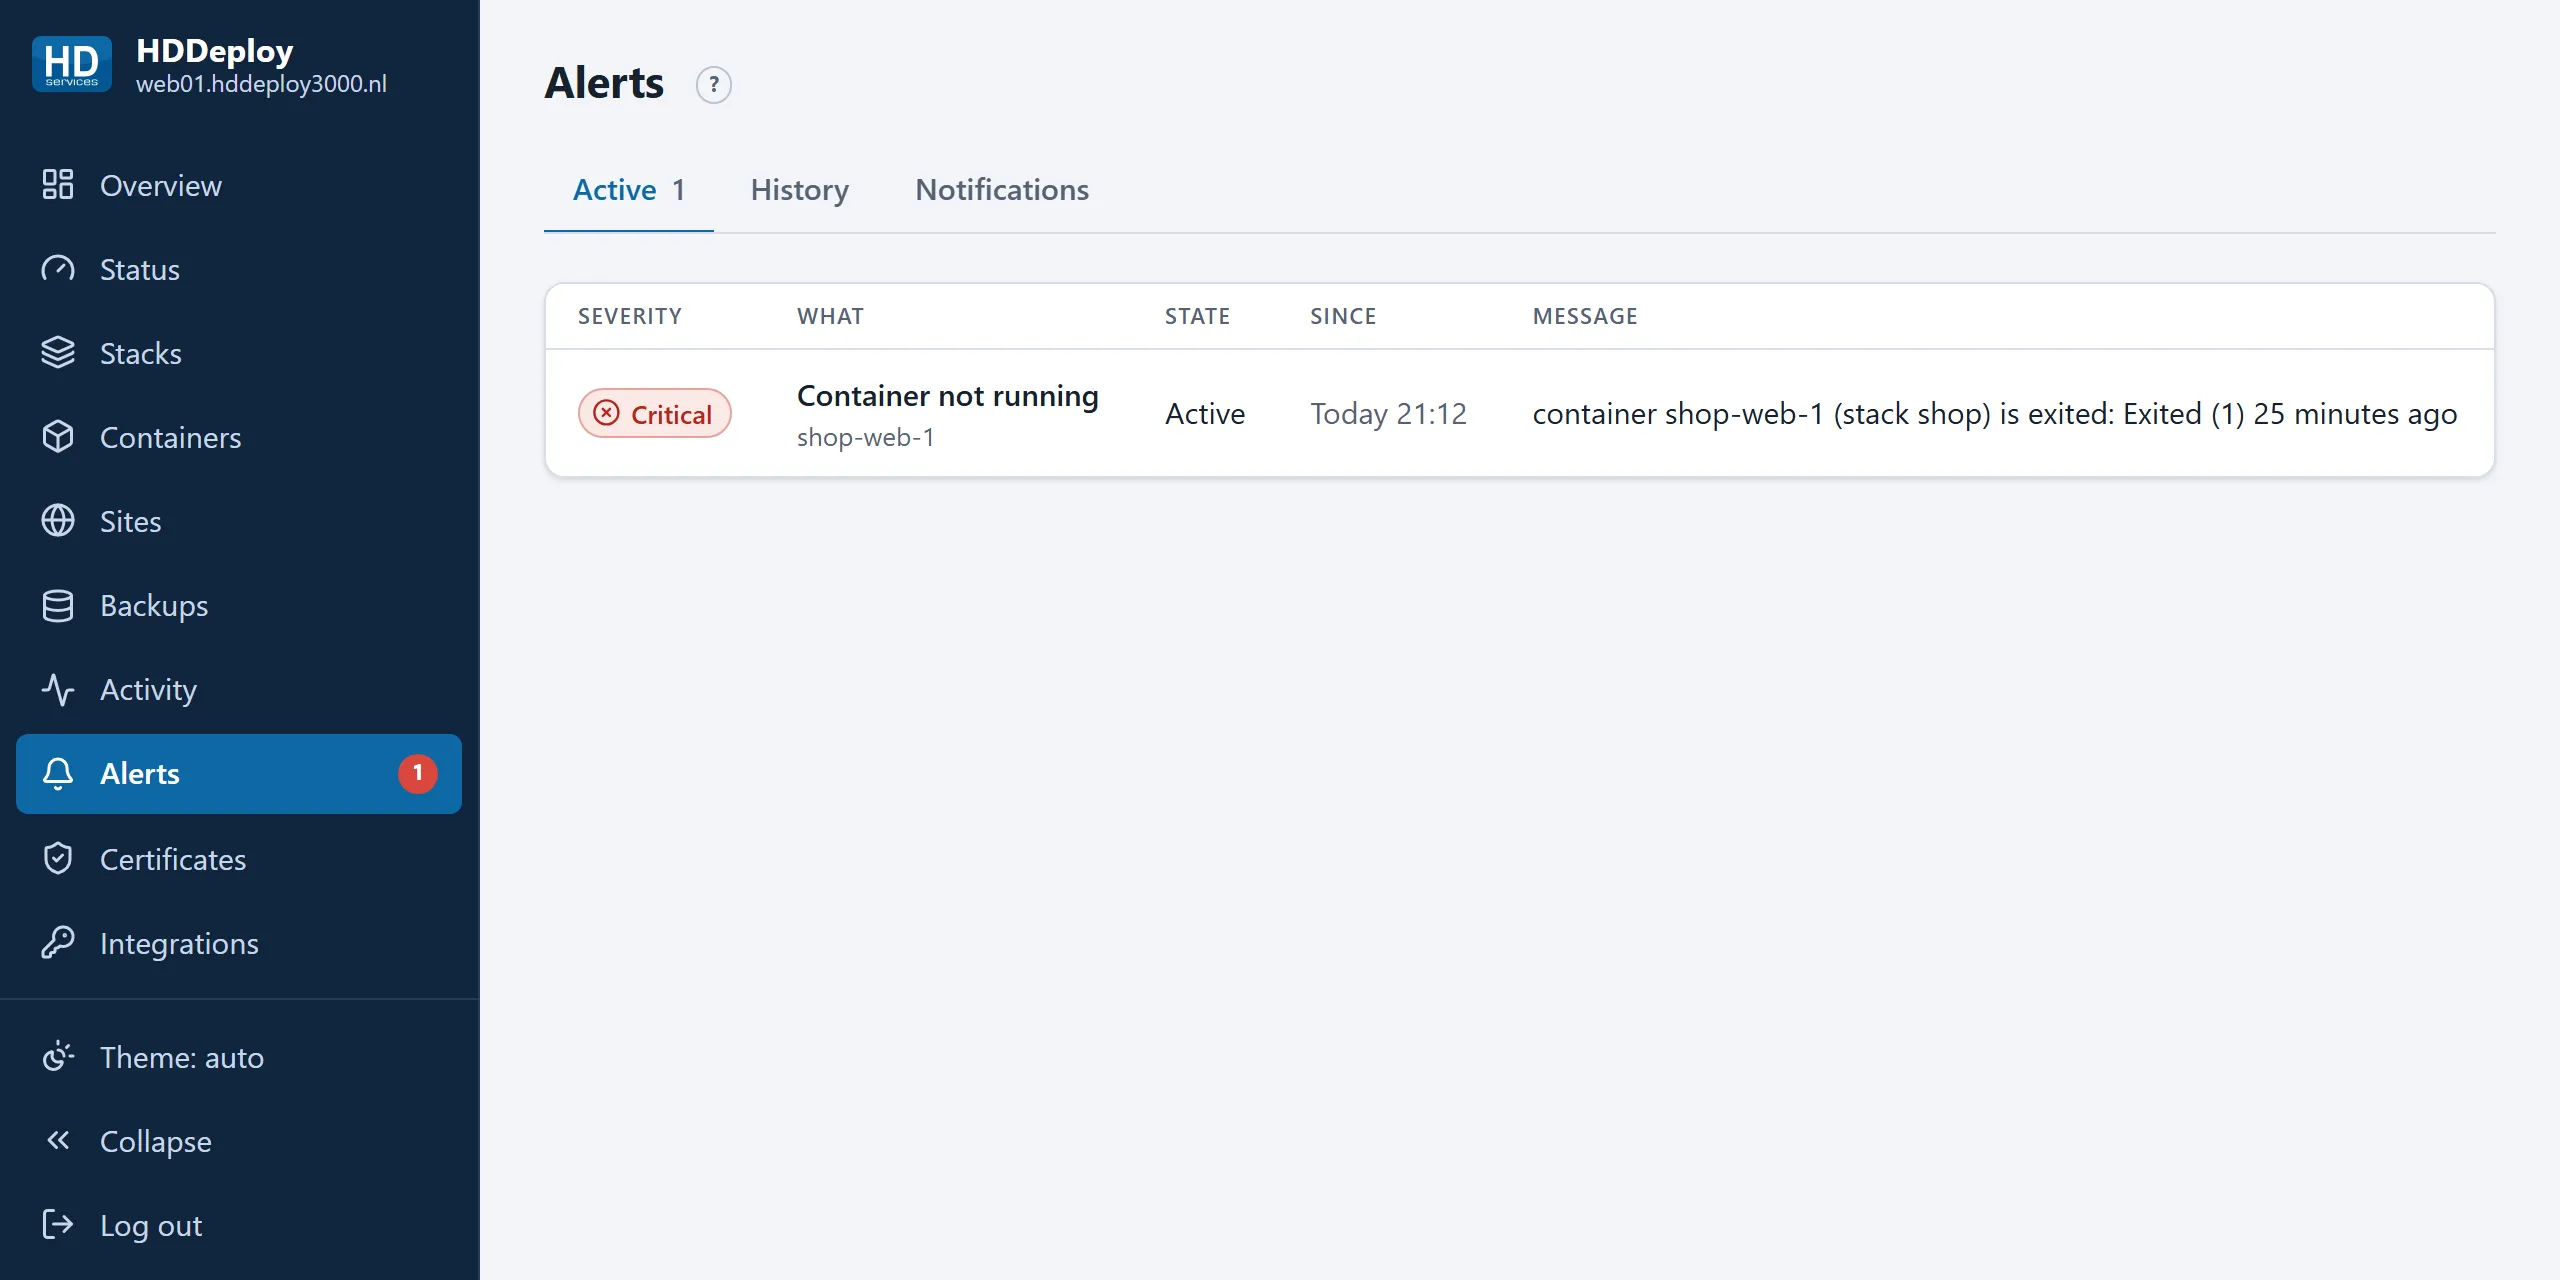
Section titled “Alerts”What is wrong right now, the history of alerts, and the e-mail addresses or webhooks your own alerts go to. The red number in the menu is the count of active alerts. More in Alerts.
Certificates
Section titled “Certificates”Only for special cases: regular sites get their HTTPS certificate automatically. Here you request a wildcard certificate or upload a certificate of your own. More in Certificates and domains.
Integrations
Section titled “Integrations”Three tabs: API tokens (keys for scripts and assistants, and the list of connected apps), Connect your AI (ready-made configuration for Claude, editors and other assistants) and Registries (logins for private container registries). More in API tokens and scopes and Connecting your AI assistant.
What technicians see in addition
Section titled “What technicians see in addition”HD Services technicians have the same pages, plus Jobs instead of Activity, Traefik (the web gateway) and System (users, networks, updates, registries). Those pages belong to the platform and are outside this knowledge base.